Oracle
1Z0-054 · Question #159
1Z0-054 Question #159: Real Exam Question with Answer & Explanation
The correct answer is D. V$EVENT_HISTOGRAM - to determine whether the TIME_WAITED is evenly distributed across. See the full explanation below for the reasoning.
Question
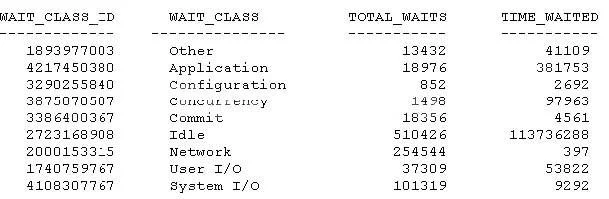
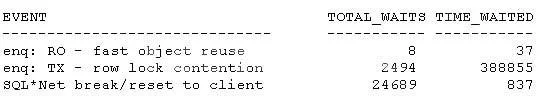
A user, SCOTT, complains that his database session, SID 249, is extremely slow in processing transactions. You check the ADDM report and do not find any overall database performance issues. You decide to check the wait events, specifically in SCOTT's session and issue the following command: SQL>SELECT wait_class_id, wait_class, total_waits, time_waited FROM v$session_wait_class WHERE sid = 249; View Exhibit1 and examine the output. You note that the APPLICATION wait class is the second most expensive wait class after the IDLE wait class. You issue the following query to identify individual waits in the APPLICATION wait class: SQL>select event, total_waits, time_waited from v$system_event e, v$event_name n where n.event_id = e.event_id and wait_class_id = 4217450380; View Exhibit2 and examine the output. Which view would you examine next to pinpoint the problem that is causing this performance issue?
Exhibits
Options
- ADBA_HIST_SESSMETRIC_HISTORY - to find the highest value metrics in the session
- BV$SQLAREA statistics - to find the SQL statements with the highest number of executions
- CV$SESS_TIME_MODEL - to identify whether the SQL statements in the session were spending
- DV$EVENT_HISTOGRAM - to determine whether the TIME_WAITED is evenly distributed across
Community Discussion
No community discussion yet for this question.